

Creativity alone doesn’t guarantee content marketing success in today’s crowded digital ecosystem. To cut through the noise, engage audiences and achieve results, your strategy must include content marketing KPIs and data-driven measurement. After all, if you can’t measure it, you can’t improve it.
Key performance indicators (KPIs) for content marketing demonstrate the heft of your content’s impact. They offer a tangible gauge of your strategy’s success and shortcomings. Tracking the right content marketing campaign KPIs transforms guesswork into evidence-based optimization.
However, the sheer volume of metrics can be overwhelming. Which content marketing KPIs should you prioritize? After all, not every metric is created equal or right for every assignment.
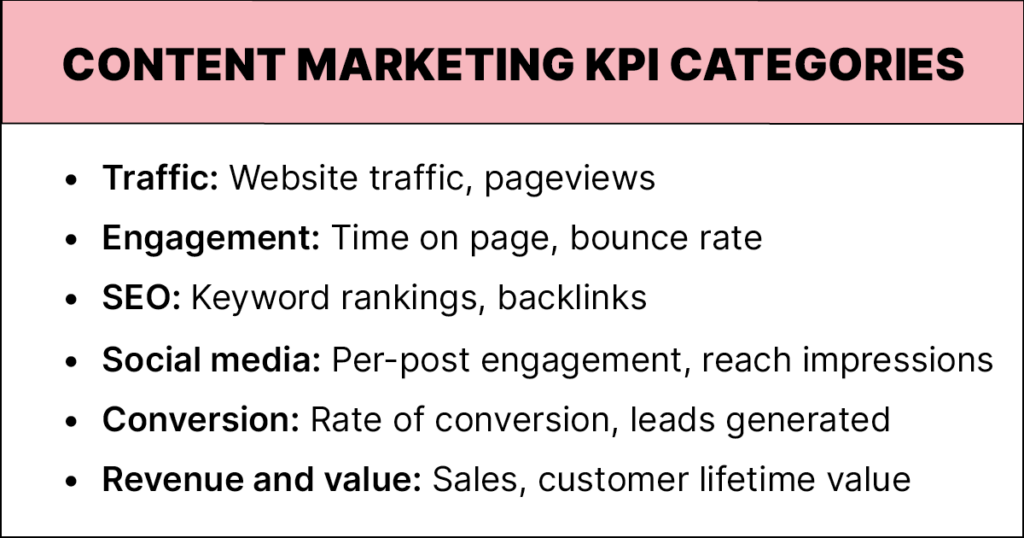
Read on to learn more about the top KPIs for content marketing that you should track. We’ll explore the significant metrics and measurement strategies, their benefits, and how they contribute to a content marketing engine that hits on all cylinders.
Traffic Metrics
Let’s begin the journey by focusing on the fundamentals: traffic metrics.
“If we build it, they will come” may have been the “Field of Dreams” mantra, but it doesn’t hold when it comes to websites nowadays. Ongoing monitoring of daily, weekly and monthly visits reveals patterns and shows whether your site is experiencing growth or crickets.
At this stage, website traffic and pageviews are the two most important high-level content marketing KPIs. They open a window into how well your website performs. Website traffic displays the big picture, and pageviews zoom in.
To successfully measure website traffic and pageviews, it’s crucial to understand their definitions and importance. This is best achieved with analytics platforms like Google Analytics.
The standard for measuring website traffic is in terms of unique visitors per month or session duration (the time users spend on your site). Pageviews refer to the total number of pages viewed in a given period, including activities such as post clicks and video plays.
You can measure both KPIs in several ways. For example, you can use content marketing analytics tools to track data points such as user engagement rate, bounce rate, average time spent on page and more. Third-party tools like BuzzSumo or Ahrefs can give you a more comprehensive view of your website’s performance metrics.
Monitoring these two content KPIs offers several key benefits. Let’s look at each in more detail.
Website Traffic
Website traffic metrics help you gauge your target audience’s overall size and quantify your potential reach. Understanding the scale of your visitor base informs decisions about content strategy, formats and marketing channel investments.
Tracking traffic over time can reveal emerging growth channels and opportunities. Spikes from new referral sources, social platforms or keywords could indicate avenues to double down — or blips that aren’t worth chasing. Broad-based traffic declines, meanwhile, should prompt an examination of your strategy.
Analyzing the breakdown of visitors by source, geography, behavior and other dimensions offers intelligence about content consumption patterns. This data helps optimize on-site content and broader distribution strategies accordingly.
Pageviews
Pageviews are a benchmark metric that identify your site’s highest-performing pages and content types. Tracking pageviews for individual pages or content assets over time helps diagnose what content works best and where underperforming content can be optimized — or avoided in the future.
Declining pageviews on a webpage that once was a destination could signal a variety of issues, such as page formatting, SEO optimization, technical problems or topic relevance.
High pageviews often correlate with increased organic visibility, which is an opportunity to convert visitors. Pages with heavy traffic volume might warrant additional optimization and promotion to maximize their visibility and revenue potential.
As you analyze pageview data, look at submetrics such as session duration and user behavior with heatmaps and scroll maps. These content strategy KPIs provide additional insight into user engagement levels and interactions.
Engagement Metrics
Engagement is the currency of digital marketing. It signifies the depth of your audience’s relationship with your content. Two significant content marketing KPIs factor into this category: Time on page and bounce rate. Google Analytics can give you data on both.
Time on Page
Time on page is a direct reflection of your content’s resonance. The longer a visitor stays, the more likely your content has struck a chord. Monitoring average time spent across different pages will tell you what interests your visitors or, conversely, sends them packing.
Monitoring time on page delivers three advantages:
- Signals content stickiness. Higher average time on page signals you’ve created compelling information that aligns with audience interests. Lower durations may indicate issues with topic relevance, writing quality or design.
- Identifies hot topics. Pages with high average time on page could contain information, topics and formats worth capitalizing on further. If a thought leadership blog post is one of your best-performing pages (and aligns with your value proposition), plan other types of content on the topic, including campaigns capitalizing on the existing piece.
- Diagnoses problems. Pages with low time on page are either attracting the wrong visitors or driving them away quickly. With this intelligence, you can refine content quality, presentation, technical aspects and on-page optimization.
Bounce Rate
Bounce rates can be boom or bust. A high bounce rate typically means people visit one page and then leave, which isn’t all that unusual, especially if they found your site without deliberately looking for it (clicking on a social link or an unclear outbound link, for example). Many of these visitors aren’t your core audience.
Content quality can be an issue, however. Unsophisticated or clickbait content can quickly drive away viewers. Another cause of high bounce rates is content that doesn’t have a call to action (CTA). The content itself might be engaging, but visitors can’t proceed further into your site because you aren’t sending them anywhere.
However, bounce rates aren’t just about content quality or brand reputation. Your website might load slowly, display poorly on phones, or present technical issues, such as a pop-up ad that’s too difficult to dismiss.
Review pages with elevated bounce rates for potential problems, including page speed, navigation, layout and formatting. Optimize those pages (or your entire website) to improve overall site performance and visitor retention.
SEO Metrics
Next, let’s examine the impact of search visibility on your content marketing. Keyword rankings and backlinks are two major KPIs to track here.
Keyword Rankings
Keyword rankings signify your site’s position in search engine results pages (SERPs) for specific keywords. Higher ranks equal greater visibility and likelihood of organic traffic. Search engine optimization generally equates to Google, but you can also optimize for other search engines, such as Bing, YouTube and Amazon.
Monitoring your search rankings provides a few benefits:
- Identifies new opportunities: Strategically target high-volume, high-value keywords where you can rank well with authoritative content.
- Identifies ongoing opportunities: Identify your best-performing pages and keywords so you can maintain that strength and avoid cannibalizing keywords.
- Flags negative trends: Detect terms where you’ve lost ground or are otherwise underperforming.
You can measure keyword rankings manually or with tools like Ahrefs, Moz or Semrush.
Manual measurement involves plugging relevant keywords into search engines and tracking their positions over time. Automated tools are faster and more reliable, as they can track thousands of keywords in SERPs, generate progress reports and even suggest content and SEO ideas.
Backlinks
Backlinks are links from other sites that point to your content. These links are important because they represent a “vote” for your site. But quality matters. Google looks for links from sites with high experience, expertise, authoritativeness and trustworthiness (EEAT). Getting many links from high-EEAT sites will drive your domain authority higher — but untrustworthy and spammy backlinks can do the opposite.
Effective backlink strategies also help you identify influential partner sites and backlink-earned opportunities. Successful relationships with such quality referrers expands your reach.
Tools like Majestic and Ahrefs can help you keep tabs on backlinks and support your backlinking strategy.
Social Media Metrics
Social media is the modern-day agora, bustling with interactions that can make or break your brand’s reputation. In this category, social media engagement and social media reach/impressions are two broad categories of KPIs to watch.
Social Media Engagement
Social engagement encompasses likes, shares, reposts, comments and similar interactions, depending on what a particular platform offers and emphasizes.
You gain valuable insights into your audience’s interests and preferences by tracking social media engagement. This knowledge can highlight what type of content does well and inform your rolling content calendar.
Reach/Impressions
If engagement metrics showcase the depth of your following’s interaction with your content, then reach and impressions highlight the breadth of its exposure. These metrics illustrate how many eyes saw your content, even if they didn’t interact.
As you consider reach and impressions, of course, look for any available data on who those people are. When you connect with the right audience, including accounts with their own followings and influence, your reach can turn into more direct engagement and fuel trust in your brand.
You can leverage native analytics for each platform to track reach, impressions and other data. Monitoring social reach and impressions has the following advantages:
- Signals total addressable audience: The number of people who viewed or had your content enter their feed establishes your overall potential audience size on each platform. More reach means greater potential awareness.
- Highlights your best platforms: Comparing reach across different social platforms provides insights into where your brand has the biggest followings, where it performs best and what content types succeed.
- Flags unusual dips: Sudden reach declines suggest that your content has become less visible or that your following is riddled with bots or inactive accounts. This could prompt an examination of algorithmic or targeting issues, as well as whether this platform remains suitable for organic social marketing. If the platform is throttling visibility to organic, you might need to shift to paid spend to regain traction and take advantage of your following..
Conversion Metrics
Thus far, we’ve explored top-of-funnel metrics related to traffic, engagement and visibility. Now, we progress to conversion KPIs that quantify your content’s ability to drive outcomes aligned with business goals.
While site visits, pageviews, search and social traffic are important, they’re less impactful if you can’t determine how they drive leads, conversions and revenue. That’s where conversion rates and leads generated are crucial content marketing KPIs. They indicate your content’s ability to move the audience down the sales funnel from awareness to interest to decision and action.
Conversion Rate
Conversion rate is the ratio of visitors who take the desired action — such as making a purchase, signing up for a newsletter or downloading a lead magnet. This metric is the litmus test for your CTAs and landing pages.
Calculate the conversion rate by dividing the total number of conversions by the total number of visitors. A healthy conversion rate signifies that your content is hitting the mark and reaching the right people at the right time.
Conversion rate is a pivotal KPI because of its ability to:
- Quantify the tangible value of your content marketing efforts. Higher conversion rates mean more visitors are taking action. Your content’s information, presentation and messaging are persuasive.
- Forecast ROI expectations and set targets for content initiatives. Knowing your content marketing ROI benchmarks enables data-driven decisions that can help you achieve more immediate and sustainable investment returns.
- Identify optimization opportunities: Design changes, faster website load times, reducing friction and clearer CTAs are just a few ways to increase conversions and revenue from content.
Leads Generated
Leads generated refers to the number of potential customers identified through content marketing activities, including blog posts, webinars, white papers, email newsletters and social media.
Every lead you capture through a conversion vehicle is a potential customer. The number of leads reflects your content’s power of persuasion. Tracking leads generated over time highlights the effectiveness of your lead magnets and offers insights into improving lead capture mechanisms.
There are many ways to measure leads generated, including downloads, webinar registrations, click-through rates on social media posts or contact form submissions.
A customer relationship management (CRM) platform is ideal for tracking this KPI.
Monitoring leads generated provides three key advantages:
- Real-time volume: The volume of leads indicates your content’s ability to attract and persuade prospects to move down the funnel. More leads signal high-performance content.
- Long-term tracking: Tracking leads over time and across assets pinpoints your most effective offers, calls to action and conversion paths. These insights inform content creation priorities.
Potential revenue attached to content: More qualified leads in your funnel fuels overall revenue potential. Higher lead counts suggest audiences are responding positively to content and engaging further.
Revenue and Value Metrics
Now, let’s talk dollars and cents. In this leg of the journey, we’ll explore sales revenue and customer lifetime value (CLV).
Sales Revenue
Sales revenue is the most obvious, direct way to measure the impact of your content efforts (i.e., revenue generated from sales attributed to content marketing). Tracking this KPI over time gives a clear picture of your content’s monetary pull.
Track revenue with CRM and sales data that’s integrated with your content campaigns. Periodic assessments inform budget and strategy optimization, as well as forecasting.
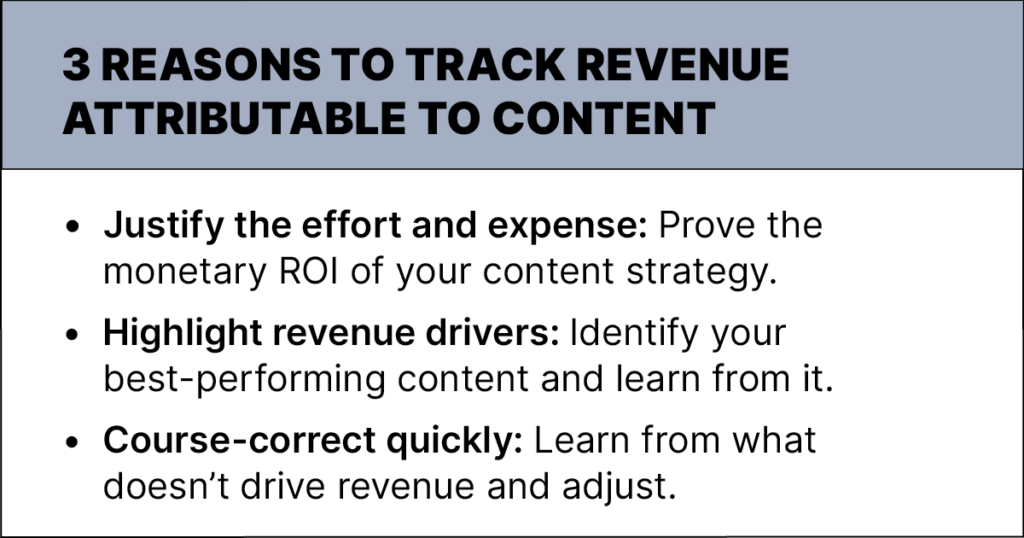
Monitoring content marketing sales revenue delivers these advantages:
- Justify the effort and expense: You can assign a monetary value to your content’s impact, justifying budgets and proving content marketing ROI. Credible revenue figures get buy-in.
- Highlight revenue drivers: By spotlighting your most profitable initiatives, channels and assets, you can double down on what monetizes.
- Course-correct quickly: Underperforming content and offers can be quickly identified, examined and either refined or replaced, all with agreement on what metrics matter.
Customer Lifetime Value
CLV takes a long-term lens by focusing on the total revenue you can reasonably expect from customers throughout their engagement with your brand. CLV is a compass for sustainable growth, optimizing marketing spend and fostering customer loyalty.
The higher the CLV, the easier it is to justify marketing investments (including content) in that type of customer..
There are three benefits to monitoring CLV:
- Anchors the long-term focus: CLV provides a benchmark for the holistic equity of each customer relationship, rather than just isolated conversions. This shifts the focus to long-term nurturing.
- Emphasizes retention: Higher CLV figures justify increased investments in retention and loyalty rather than constantly chasing acquisition and battling churn. The data can show the revenue impact of departing customers, too.
- Informs content strategy: CLV data can guide decisions on content marketing and customer acquisition budgets. Targeting looks different for high-CLV audiences versus low-CLV audiences.
Content Marketing KPI Best Practices
With our content marketing KPI journey complete, let’s conclude with two fundamental best practices:
Evaluate Marketing Efforts Periodically
Conduct periodic assessments of your content performance across KPIs to pinpoint areas for improvement, refinement or total revamping based on evidence. Be responsive to trends, both positive and negative. Continuously optimize. You can do this as part of regular planning cycles for budgeting and editorial calendars, for instance.
Tie Content Marketing Initiatives and KPIs to Business Goals
KPIs should directly tie to overarching business goals and translate into tangible outcomes that fuel growth. Every metric you track should ladder up to revenue, conversions, lowered costs or other goals. Measurement for measurement’s sake is a wasted effort.
(It’s also crucial for marketers to set realistic content marketing goals when using KPIs so they know what success looks like.)
Start Measuring Content Marketing KPIs
Now that you know what to measure performance against, you can turn a keener eye to analyzing content marketing metrics and making strategic content decisions based on your findings. While great content is at the heart of any content strategy, it’s easy to lose sight of whether your efforts are succeeding. By tracking your performance against KPIs, you can improve when, where and how you create content.
Rather than merely chasing arbitrary numeric goals, anchor your KPIs in business value. Let data guide your content to boost financial performance while building stronger connections with your audience.To get more expert insights and helpful tips like these, subscribe to Managing Editor’s weekly newsletter.